Well-Ahead Louisiana Data Visualizations
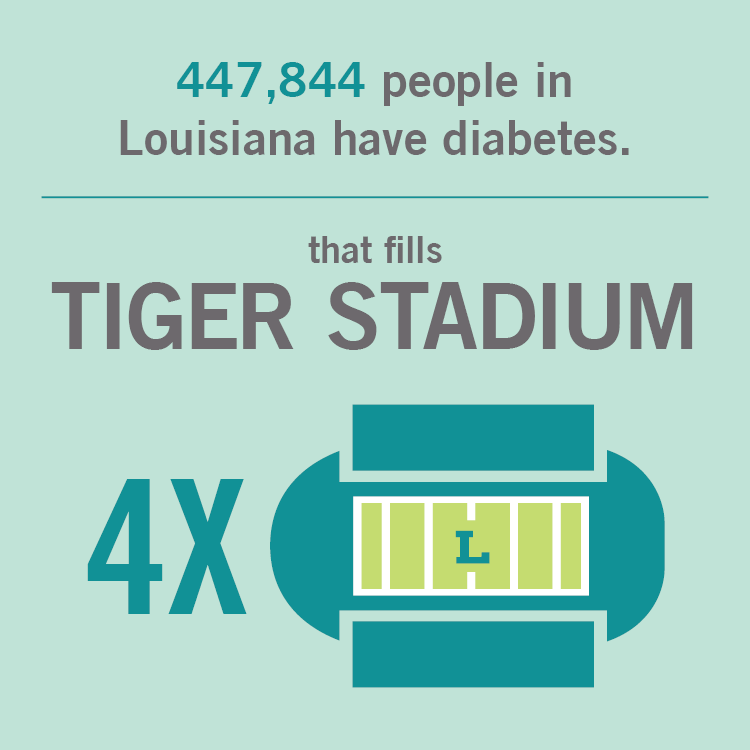
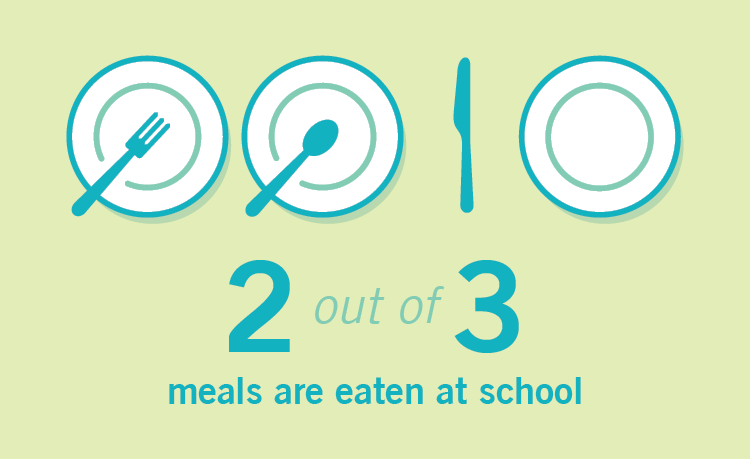
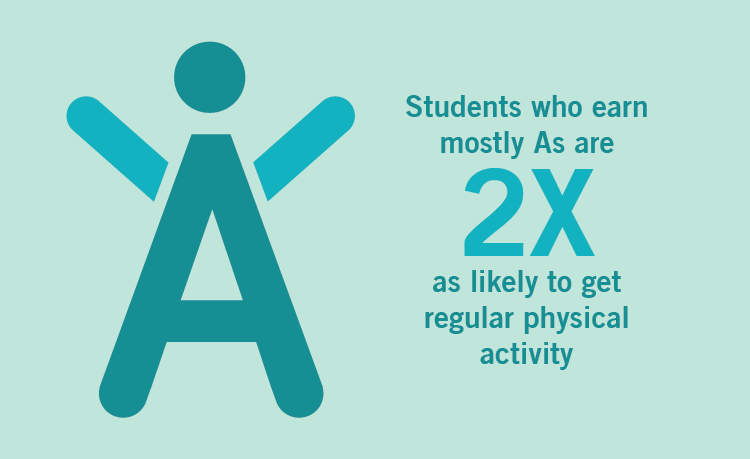
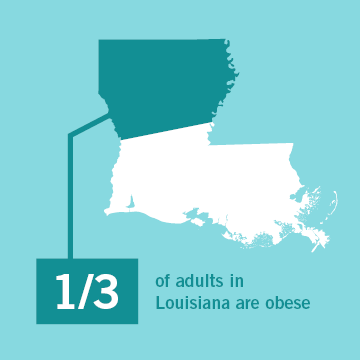
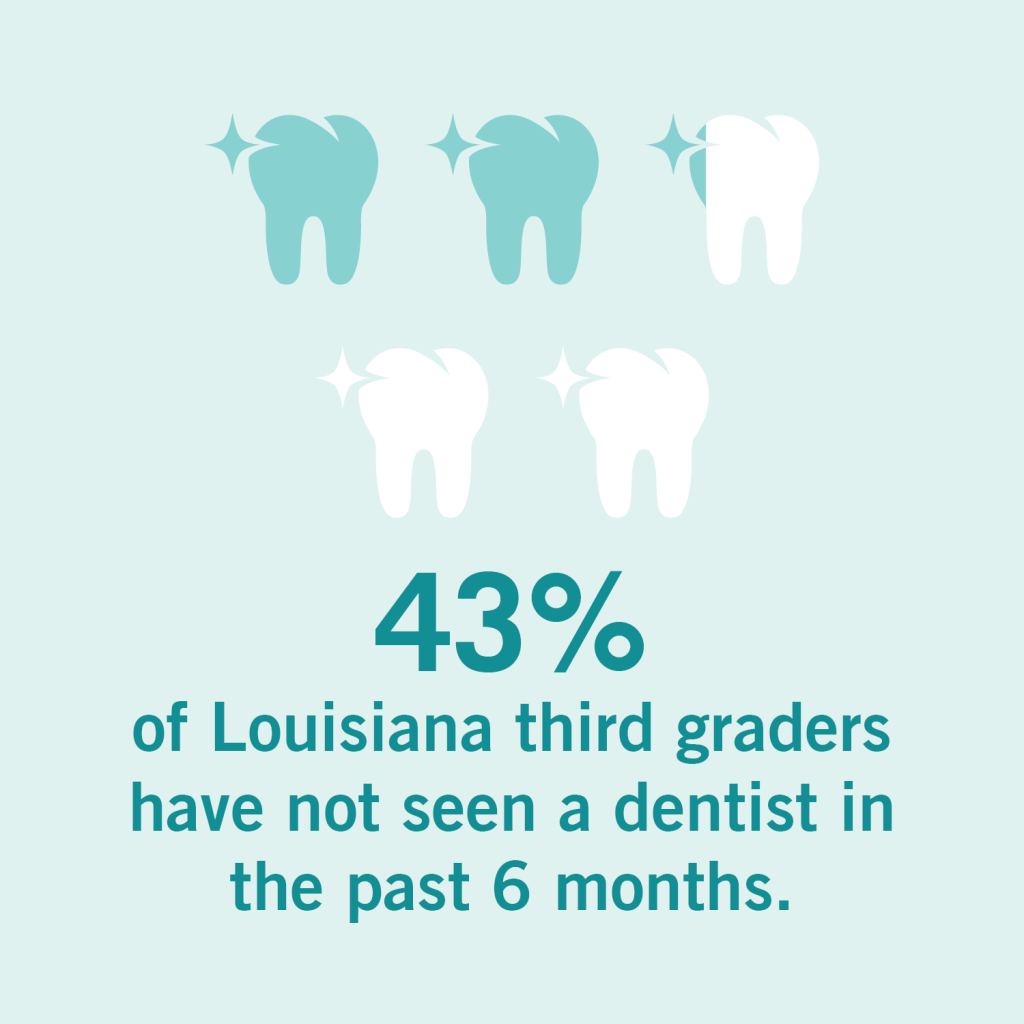
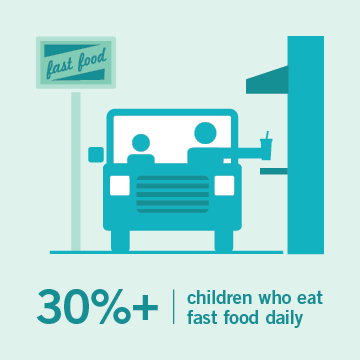
Well-Ahead Louisiana often needs to share the health challenges in the state of Louisiana directly with partners, stakeholders, local leaders, or residents. Data visualizations are created to support Well-Ahead in relaying why its program are needed and clearly defining the health challenges before offering solutions to create change. These graphics are sometimes created using social math to better connect with Louisiana residents. Additional examples of data visualizations can be viewed throughout the website at https://wellaheadla.com/.